Before you start real-time simulation trading or live trading with your strategy, rolling optimization backtesting is absolutely the last test you should focus on.
Many people may have experienced using hyperparameter optimization to multiply the returns of an initial strategy several times. This looks great, but when faced with such a beautifully presented backtest report, how confident are you that this set of parameters will continue to achieve good returns in the future?
Not only are trading strategies based on machine learning and neural networks prone to overfitting, but those based on traditional indicators and hyperparameter optimization are also likely to yield overfitted parameters.
In fact, when you use a fixed period backtest report to assume future returns, you have already made a mistake!
We should always base our backtesting on new data. If you have three years of data, you can use the first two years to perform hyperparameter optimization to obtain a set of parameters, and then backtest against the last year.
In the real world, we might prefer to perform hyperparameter optimization every few months to avoid continuous losses due to market changes. Therefore, a more realistic approach could be: if we have the most recent three years of data, first use the earliest year’s data for hyperparameter optimization, then backtest the next two months with the optimized parameters. After two months, delay one year of data to continue hyperparameter optimization, and repeat the backtesting for the following two months in a rolling manner. Ultimately, we can obtain a set of backtest reports for the most recent two years without future information.
In banbot, you can achieve this process using the command below:
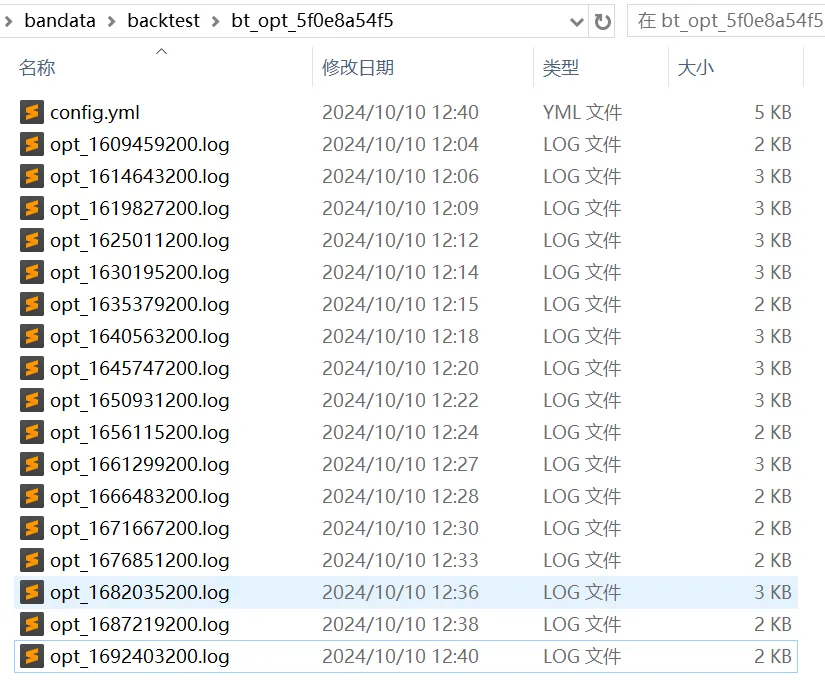
bot bt_opt -review-period 12M -run-period 2M -opt-rounds 20 -picker scoreAfter the rolling optimization backtest is completed, we will obtain a folder containing the logs of each optimization:

Each log file in the figure represents a log of a hyperparameter optimization. Let's open the first one to see the results:
# run hyper optimize: bayes, rounds: 20
# date range: 2021-01-01 00:00:00 - 2021-12-27 00:00:00

============== freqtrade:Strategy001/5m/ =============
loss:  -81.15  bigRate: 2.02, lenSml: 19.49, midRate: 2.38  odNum: 195, profit: 109.7%, drawDown: 18.2%, sharpe: 6.89
loss:  -86.14  bigRate: 2.00, lenSml: 20.71, midRate: 3.72  odNum: 292, profit: 107.8%, drawDown: 13.9%, sharpe: 7.69
loss: -118.02  bigRate: 2.15, lenSml: 20.92, midRate: 2.71  odNum: 210, profit: 167.9%, drawDown: 20.9%, sharpe: 7.49
loss:  -72.20  bigRate: 1.90, lenSml: 20.89, midRate: 2.52  odNum: 220, profit: 100.6%, drawDown: 19.8%, sharpe: 6.73
loss:  -80.40  bigRate: 2.17, lenSml: 22.64, midRate: 1.96  odNum: 148, profit: 115.2%, drawDown: 21.3%, sharpe: 6.66
loss:  -90.39  bigRate: 1.88, lenSml: 23.61, midRate: 2.79  odNum: 183, profit: 164.5%, drawDown: 32.9%, sharpe: 5.15
loss:  -93.75  bigRate: 1.84, lenSml: 16.12, midRate: 2.43  odNum: 247, profit: 126.3%, drawDown: 18.0%, sharpe: 7.04
loss:  -72.83  bigRate: 1.98, lenSml: 19.76, midRate: 3.77  odNum: 293, profit: 91.1%, drawDown: 13.9%, sharpe: 6.80
loss:  -71.02  bigRate: 1.93, lenSml: 19.75, midRate: 3.89  odNum: 304, profit: 97.6%, drawDown: 19.1%, sharpe: 6.64
loss: -140.38  bigRate: 2.61, lenSml: 27.93, midRate: 3.90  odNum: 192, profit: 191.3%, drawDown: 18.6%, sharpe: 8.48
loss:  -95.02  bigRate: 2.88, lenSml: 23.35, midRate: 2.77  odNum: 192, profit: 165.0%, drawDown: 30.8%, sharpe: 8.92
loss:  -78.63  bigRate: 2.02, lenSml: 29.28, midRate: 3.28  odNum: 212, profit: 109.3%, drawDown: 19.7%, sharpe: 6.81
loss:  -81.46  bigRate: 2.69, lenSml: 21.28, midRate: 3.71  odNum: 258, profit: 109.1%, drawDown: 17.7%, sharpe: 7.20

  # score: 140.38
  - name: freqtrade:Strategy001
    run_timeframes: [ 5m ]
    params: {bigRate: 2.61, lenSml: 27.93, midRate: 3.90}
Due to the small search space, Bayesian optimization terminated after 13 iterations, and then banbot automatically selected the set of parameters with the highest score (i.e., the lowest loss) for the subsequent 2-month backtest.
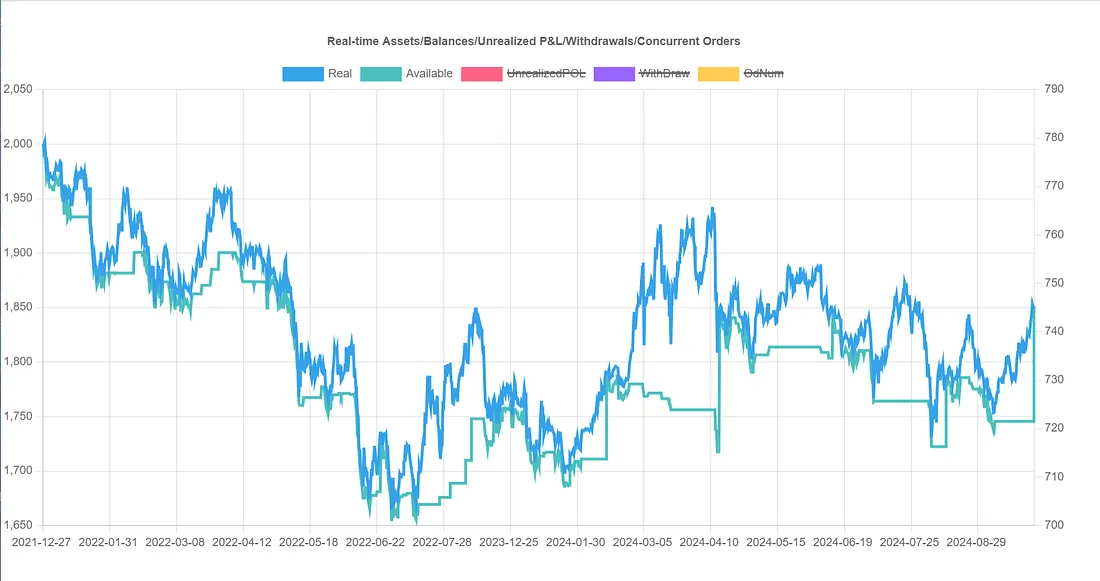
In this way, banbot will ultimately combine all the 2-month interval backtest results into a single backtest report:

From the combined report, the overall return is -7%, which is even far worse than the initial strategy's 7% return; thus, the parameter set with the highest score from hyperparameter optimization performed worse in the future than the initial parameters! This indicates that overfitting has occurred!
How can we avoid overfitting? Perhaps we can take the average of all parameter sets that yielded positive returns for the backtest over the next 2 months? Let's try the rolling optimization test (we just need to change the picker from score to goodAvg):
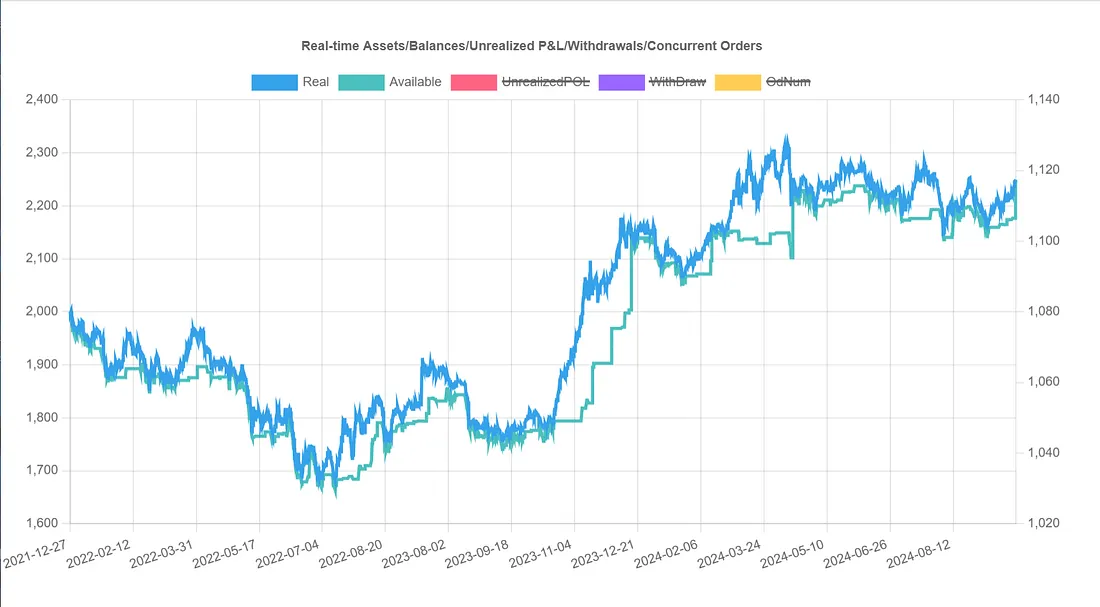
bot bt_opt -review-period 12M -run-period 2M -opt-rounds 20 -picker goodAvg
This modification achieved great results, with a cumulative return of 12.4%, far exceeding the initial strategy's 7% return! But what if we use other methods to select parameter sets from the hyperparameter optimization results? Would the results be even better?
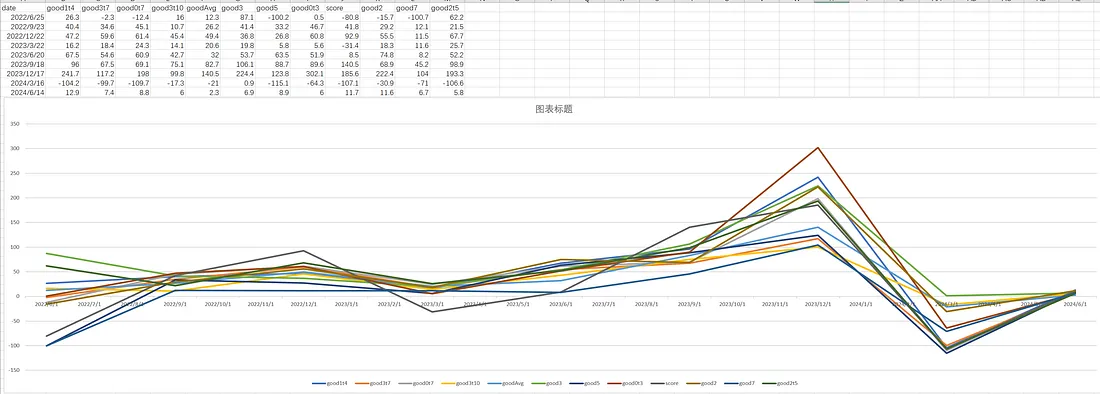
We can still use the rolling test method to test several built-in pickers in banbot, comparing the backtest scores of different pickers over 2 months. We should be able to obtain 17 sets of scores:
bot tool test_pickers -review-period 12M -run-period 2M -opt-rounds 20After execution, we can find a pickerScores.csv file in the output directory. Let's open it with Excel and then plot a line chart: 
Note
Due to the minimal score differences for different pickers in Strategy001, this chart is based on tests of other strategies.
Our evaluation criteria should prioritize selecting as many profitable parameters as possible while maintaining low drawdown.
From the chart, good3 is the most suitable, as it sorts the hyperparameter optimization results by descending score, filtering out losses, and taking the parameters in the 30% position of the profitable set. This is also the default picker in banbot.
This aligns with our basic intuition: select profitable parameters, but avoid choosing the highest scoring ones to prevent overfitting.