bot optimize -out PATH [-opt-rounds 30] [-sampler bayes]After defining hyperparameters and their ranges using pol.Def in your strategy, you can perform hyperparameter tuning.
At startup, you need to specify an output file where the results of the hyperparameter search will be written, usually in the format of opt1.log. You can specify the number of tuning executions with -opt-rounds and the sampling optimizer with -sampler. During tuning, the -nodb parameter will be fixed.
If you have multiple strategies that need optimization, by default, banbot will search each strategy one by one; if you want to improve concurrency, you can compile it into an executable file and pass the -concur parameter to control the number of concurrent processes.
You can use -picker to specify a picker name for selecting a set of parameters from the search results. If not specified, the default will use good3.
Usage of optimize:
  -concur int
        Concurrent Number (default 1)
  -config value
        config path to use, Multiple -config options may be used
  -datadir string
        Path to data dir.
  -each-pairs
        run for each pairs
  -level string
        set logging level to debug (default "info")
  -logfile string
        Log to the file specified
  -max-pool-size int
        max pool size for db
  -no-compress
        disable compress for hyper table
  -no-default
        ignore default: config.yml, config.local.yml
  -nodb
        dont save orders to database
  -opt-rounds int
        rounds num for single optimize job (default 30)
  -out string
        output file or directory
  -picker string
        Method for selecting targets from multiple hyperparameter optimization results (default "good3")
  -sampler string
        hyper optimize method, tpe/bayes/random/cmaes/ipop-cmaes/bipop-cmaes (default "bayes")
After completing hyperparameter optimization, you can open the output file to see the logs:
# run hyper optimize: bayes, rounds: 20
# date range: 2021-01-01 00:00:00 - 2021-12-27 00:00:00

============== freqtrade:Strategy001/5m/ =============
loss:  -81.15 	bigRate: 2.02, lenSml: 19.49, midRate: 2.38 	odNum: 195, profit: 109.7%, drawDown: 18.2%, sharpe: 6.89
loss:  -86.14 	bigRate: 2.00, lenSml: 20.71, midRate: 3.72 	odNum: 292, profit: 107.8%, drawDown: 13.9%, sharpe: 7.69
loss: -118.02 	bigRate: 2.15, lenSml: 20.92, midRate: 2.71 	odNum: 210, profit: 167.9%, drawDown: 20.9%, sharpe: 7.49
loss:  -72.20 	bigRate: 1.90, lenSml: 20.89, midRate: 2.52 	odNum: 220, profit: 100.6%, drawDown: 19.8%, sharpe: 6.73
loss:  -80.40 	bigRate: 2.17, lenSml: 22.64, midRate: 1.96 	odNum: 148, profit: 115.2%, drawDown: 21.3%, sharpe: 6.66
loss:  -90.39 	bigRate: 1.88, lenSml: 23.61, midRate: 2.79 	odNum: 183, profit: 164.5%, drawDown: 32.9%, sharpe: 5.15
loss:  -93.75 	bigRate: 1.84, lenSml: 16.12, midRate: 2.43 	odNum: 247, profit: 126.3%, drawDown: 18.0%, sharpe: 7.04
loss:  -72.83 	bigRate: 1.98, lenSml: 19.76, midRate: 3.77 	odNum: 293, profit: 91.1%, drawDown: 13.9%, sharpe: 6.80
loss:  -71.02 	bigRate: 1.93, lenSml: 19.75, midRate: 3.89 	odNum: 304, profit: 97.6%, drawDown: 19.1%, sharpe: 6.64
loss: -140.38 	bigRate: 2.61, lenSml: 27.93, midRate: 3.90 	odNum: 192, profit: 191.3%, drawDown: 18.6%, sharpe: 8.48
loss:  -95.02 	bigRate: 2.88, lenSml: 23.35, midRate: 2.77 	odNum: 192, profit: 165.0%, drawDown: 30.8%, sharpe: 8.92
loss:  -78.63 	bigRate: 2.02, lenSml: 29.28, midRate: 3.28 	odNum: 212, profit: 109.3%, drawDown: 19.7%, sharpe: 6.81
loss:  -81.46 	bigRate: 2.69, lenSml: 21.28, midRate: 3.71 	odNum: 258, profit: 109.1%, drawDown: 17.7%, sharpe: 7.20

  # score: 140.38
  - name: freqtrade:Strategy001
    run_timeframes: [ 5m ]
    params: {bigRate: 2.61, lenSml: 27.93, midRate: 3.90}
Overfitting Trap
Hyperparameter optimization is not magic; it essentially tests different parameters of a strategy over a period of time to identify those that yield better returns.
We all know that trading strategies based on machine learning and neural networks are prone to overfitting, meaning they perform excellently on training data but yield poor returns on testing data.
Hyperparameter optimization is similar to the above process, where the data used to search for parameters can be viewed as training data. We select the set of parameters that perform best on the training data, but it is difficult to say that these parameters will continue to yield good returns in the future (in fact, they may result in losses).
This is because the parameters that perform best on the training data have likely overfitted.
To avoid overfitting, we need some method to derive the best-performing parameters for the future from the search records. Banbot provides the -picker parameter to achieve this.
The built-in pickers in banbot are:
- score: Select the one with the highest score (lowest loss).
- good3: Filter profitable groups by descending score, taking the top 30% of parameters.
- good0t3: Filter profitable groups by descending score, taking the average of the top 30% of all groups to form a set of parameters.
- goodAvg: Take the average of all profitable groups to form a set of parameters.
- good1t4: Filter profitable groups by descending score, taking the average of all groups in the 10% to 40% range.
- good4: Filter profitable groups by descending score, taking the parameters in the top 40%.
- good2: Filter profitable groups by descending score, taking the parameters in the top 20%.
- good5: Filter profitable groups by descending score, taking the parameters in the top 50%.
- good7: Filter profitable groups by descending score, taking the parameters in the top 70%.
- good2t5: Filter profitable groups by descending score, taking the average of all groups in the 20% to 50% range.
- good3t7: Filter profitable groups by descending score, taking the average of all groups in the 30% to 70% range.
- good0t7: Filter profitable groups by descending score, taking the average of all groups in the top 70%.
- good3t10: Filter profitable groups by descending score, taking the average of all groups beyond the top 30%.
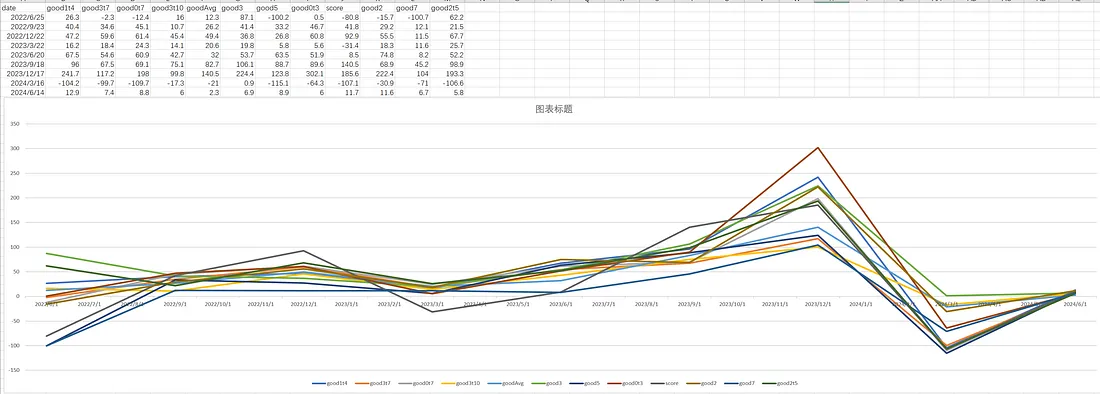
You can use bot tool test_pickers to test the scores of all pickers in future backtesting.
After multiple tests, we found that good3 slightly outperforms other pickers in most cases. The ones that perform slightly worse than good3 are: good0t3/goodAvg/good1t4/good4; most of the other pickers generally perform poorly or average.
This is the performance of different pickers tested on a certain set of strategies using tool test_pickers:

If you are unsure whether your backtest report is overfitting, we strongly recommend using Rolling Optimization Backtest!